
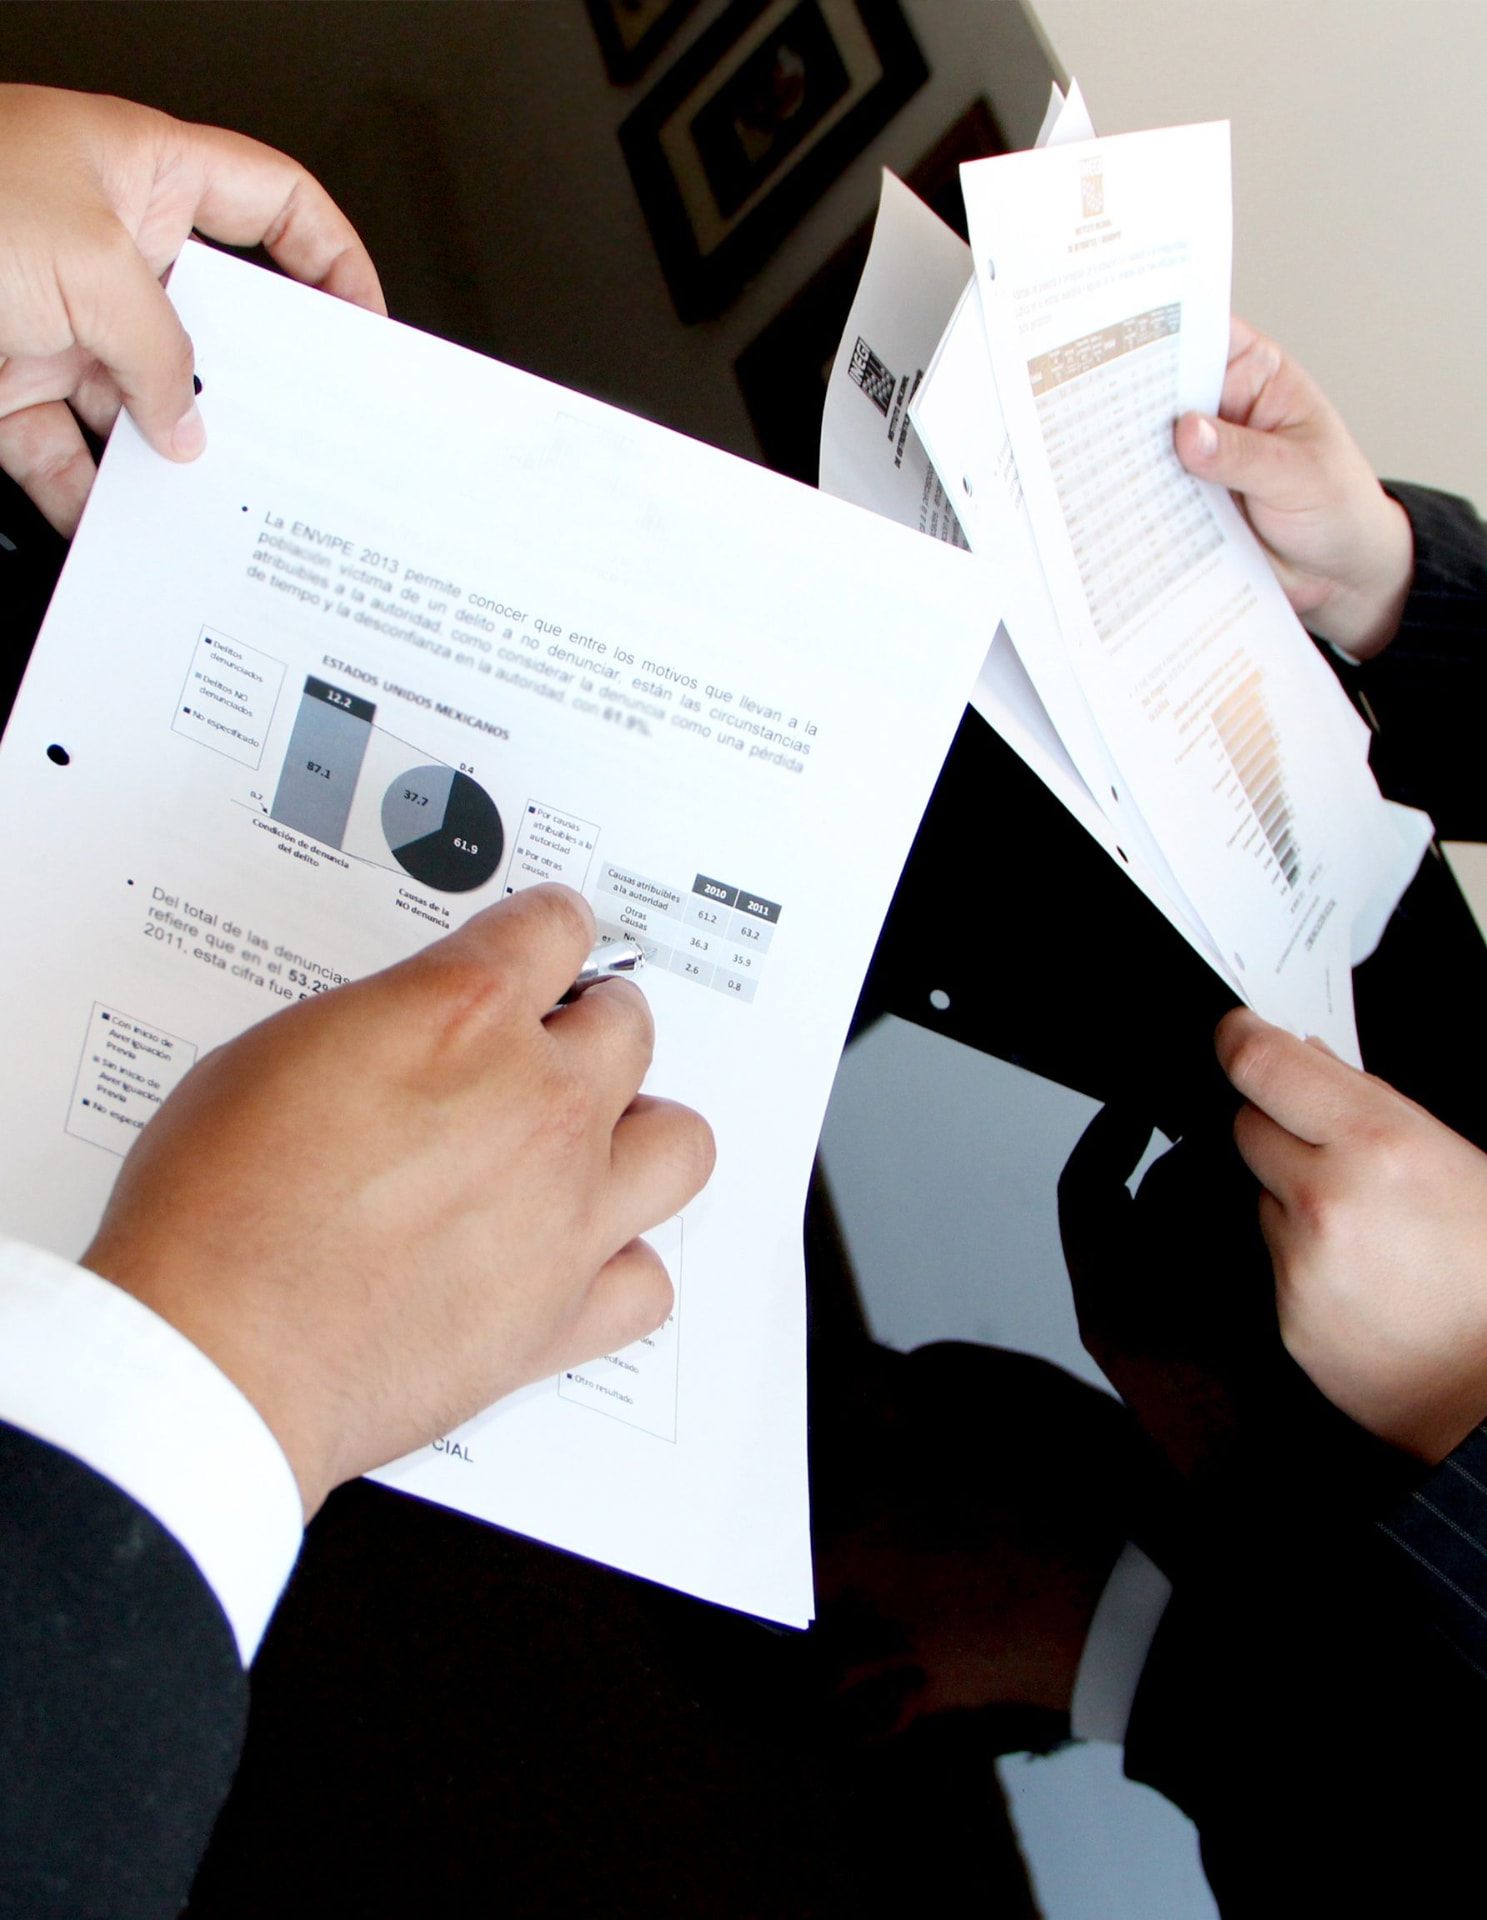
Start with the question
Every engagement opens with a data discovery session: what decisions are you making, what would change your mind, and which numbers are missing today.
Freelance Data & Analytics Consulting
Turning messy data into clear decisions your team can act on—week one.
Data scientist with 10 years in data and analytics. I build executive KPI dashboards, connect scattered data sources into reliable pipelines, and measure what actually drives growth—from media mix models to A/B tests.

Nataliia Shcheglova
Data Scientist · Analytics Leader
The approach
A dashboard nobody opens is a cost, not an asset. I start with the decisions your team needs to make, then work backwards to the data, the model, and the report—so the numbers get trusted and used.
Every engagement opens with a data discovery session: what decisions are you making, what would change your mind, and which numbers are missing today.

I connect scattered sources—ad platforms, product events, CRM, spreadsheets—into a single pipeline with quality checks you can rely on.
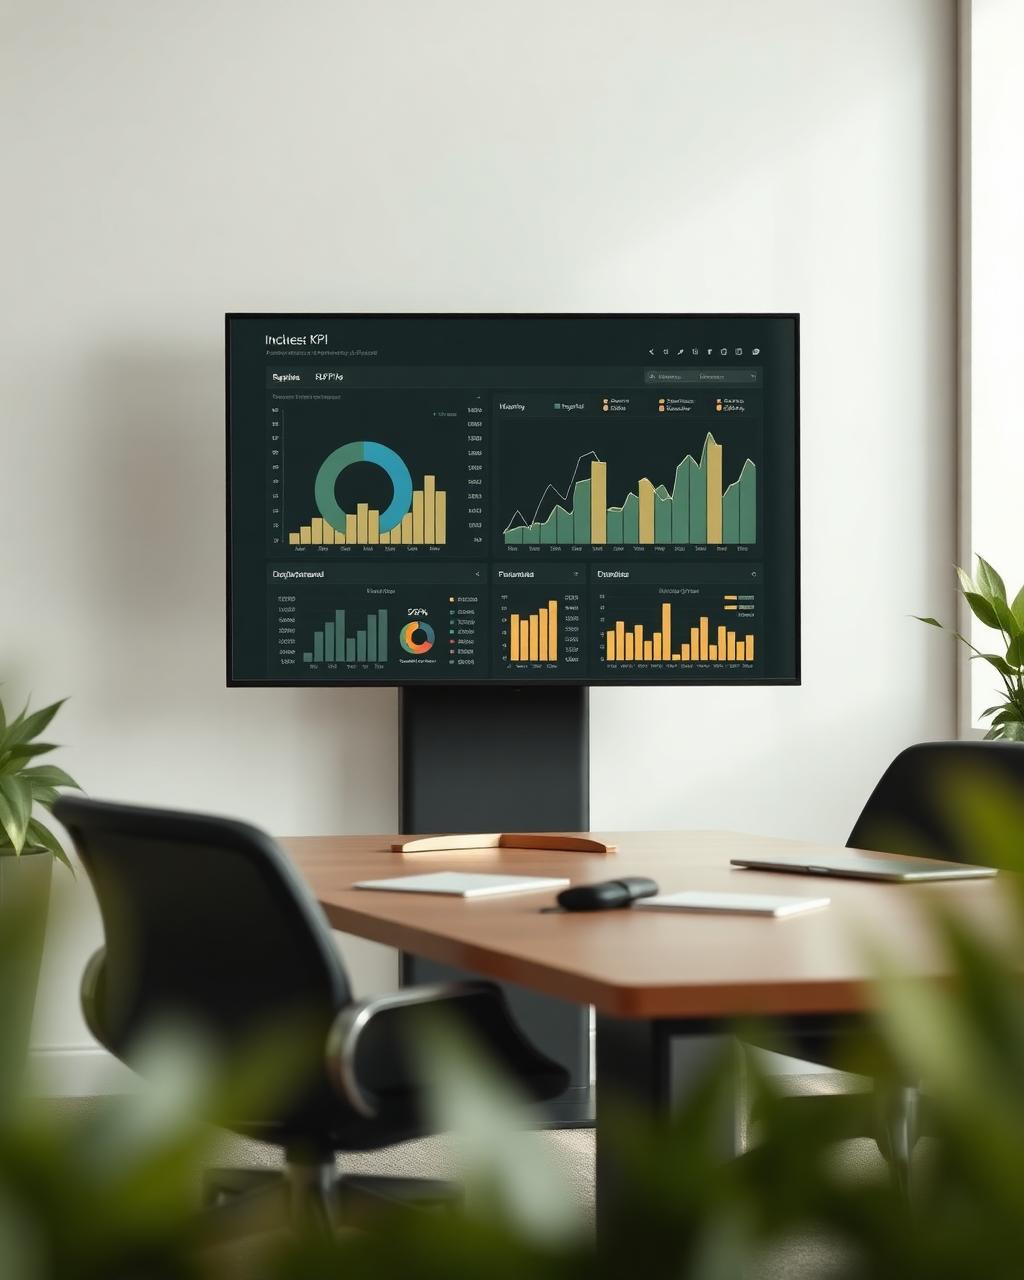
Clean, easy-to-navigate reporting built for the people reading it, from C-level KPI views to self-service exploration for analysts.

Numbers come with a recommendation. You get the analysis, the caveats, and a clear next step—documented so your team can repeat it.
Services
Projects are scoped tightly around a decision you need to make. Each one starts with a conversation, not a proposal template.
From data discovery to a live, easy-to-navigate dashboard your leadership team opens every morning—built in Power BI, Tableau or your stack of choice.
Replace manual, copy-paste reporting with automated workflows—AI-assisted data prep, commentary and quality checks that free your team for real analysis.
Experiments designed to answer a real question: sizing, guardrail metrics, and an honest read of the results—including when the result is inconclusive.
Behaviour-based segments that marketing and product can act on, connected to retention, churn prevention and personalised campaigns.
Measure how each marketing channel contributes to sales and revenue, and find the spend level that matches your objective—efficiency or profit.
Senior data leadership for startups without a full-time hire: analytics strategy, tooling decisions, hiring support and mentoring for your first analysts.

How the work runs
“Good analytics isn’t a report. It’s a shared understanding—built one trusted number at a time.”
Nataliia Shcheglova · Data & Analytics Consultant

Data Scientist · Analytics Leader
Nataliia Shcheglova
10 years in data & analytics
About
I’m a data scientist with 10 years of experience in data and analytics. In my current role I create dashboards and run performance analysis for advertising agency clients—data discovery sessions, connecting data from different sources into one pipeline, and building dashboards that are easy to navigate.
Before that I worked for tech companies, analysing marketing funnels, product feature usage and user retention, and leading analytics teams. I’ve worked in four countries, most of the time in international environments.
As a freelancer I take on the work I enjoy most: making a company’s data legible, so the people running it can decide with confidence.
Every company already has the data. My job is to turn it into something you can look at once a week—and know exactly what to do next.
Nataliia Shcheglova · Data & Analytics Consultant
Portfolio
A mix of client work and case studies across dashboards, customer classification, media mix modelling, A/B testing and churn prediction. Several write-ups include the notebooks and full reports.
Browse the full case study portfolio ↗Experience
Four countries, mostly international teams—from building an analytics function from scratch to running reporting for agency clients.
Contact
Whether you need a dashboard, a model, or a second opinion on your analytics setup—tell me what you’re working on and I’ll reply within one business day.
Email · nataliia.shcheglovaa@gmail.com
LinkedIn · Nataliia Shcheglova
A relaxed conversation about your data, your team and what you're trying to decide. No agenda, no slides.
Book a call→Have a defined need—a dashboard, a model, an experiment? Share the context and I'll come back with scope, timeline and price.
Describe your project→Both options open an email with a short template. I usually reply within one business day.